
Today we are extremely excited to open-source Open Data Fabric - the result of our long journey into creating the first collaborative supply chain for the world’s growing volumes of data.
When I started this project 3 years ago my goal was to improve upon established data management workflows and make DIY data science more pleasant and productive - I had no idea where this path will take me. When I look at the project now I see something much bigger than that, something that can help democratize the data around the world, bridge the gap between the enterprise and the open data, boost data-driven journalism, and create more effective governments. I am very biased of course, so let me tell you the whys and hows so you can form your own opinion.
Note: This post is also available in video form here.
More Data, Less Insight #︎
Data is the most powerful decision-making tool at our disposal. However, for decades, despite the rapidly increasing volumes of data generated in the world, we have not seen any significant shift towards putting it to effective use. Governments, institutions, and businesses remain impaired in their ability to make data-driven decisions because we cannot seem to be able to get the relevant data fast enough when it’s needed. Data remains siloed, hard to find, hard to access, and of bad quality.
While the enterprise data pipelines keep getting bigger and faster they remain fully siloed to the data produced within an enterprise itself. The vast majority of organizations that cannot afford to invest millions into their data infrastructure are being left far behind. We live in a world where NHS shares lab test results through Excel and UN Statistics Division operates mainly on PDF spreadsheets. With the turn-around times on data measuring in years, we remain very far from having true data-driven arguments and objectively measuring the effects of important decisions.
Example: Covid-19 Response and The Surgisphere Scandal #︎
Problems of data were apparent for a long time, but Covid-19 has put them under the spotlight. The lack of established ways to exchange and access data was a highly recognized contributing factor in our poor response to the pandemic, with scientific and medical communities putting up calls for action to address this problem. The case of the retracted hydroxychloroquine paper might be the most prominent recent example.
This study, published in the influential journal “The Lancet”, found that hydroxychloroquine, a promising drug for treating Coivd-19 actually resulted in an increased risk of in-hospital mortality. Authors claimed that the study is based on more than 96,000 Covid-19 patients in 671 hospitals worldwide - a very impressive amount of data for the early days of the pandemic. The study of such magnitude led to global trials of hydroxychloroquine for Covid-19 being halted completely.
After the publication, however, a flood of concerns about the accuracy of data had started pouring in, as some basic numbers were not checking out. Hospitals that were quoted in the paper have spoken out, saying that they did not have any existing arrangements to supply such data to other parties. The study was found to be based on the database of the privately-owned company Surgisphere that had some undisclosed process for collecting medical data. The requests for an independent company to perform an audit of the database were denied based on “privacy concerns”, so authors had no other choice than to retract the publication as the validity of data could not be confirmed. Several other studies that were based on the Surgisphere’s database later got retracted as well.
Surgisphere’s website is now down, but what remains is this infuriating evidence of how we are mishandling even the most critical data such as medical records. A data provenance issue that was left unchecked for years has significantly disrupted the life-saving efforts, derailed many other studies, and spread even more confusion at this critical time.
The Sisyphus Rock #︎
Silos, discoverability, and provenance are all complex problems that will not disappear overnight. Solving them requires a continuous process of incremental improvements. Unfortunately, we believe that our workflows are not suited even for that.
Ability to make sustainable progress as a society requires a strict and rigorous workflow, and our main and only tool for that is the scientific method. However a striking 90% of the scientists believe that reproducibility - the cornerstone of the scientific method - is in a crisis. Scientists not only can’t reproduce experiments done by other researchers, but often can reproduce even their own work!
We believe that this problem is rooted in how we manage data. There is no reliable and widely accepted way to make any improvements to data. Whenever a dataset is downloaded from a trusted source even a single well-intentioned modification completely invalidates its trustworthiness.
By changing a single bit in a dataset you are in fact create a completely new dataset validity of which cannot be easily verified.
Whenever you download a dataset from GitHub or Kaggle that someone else has converted or cleaned up you are putting an enormous amount of trust in them, hoping that they have not accidentally or maliciously altered the data. Only by repeating all the steps yourself you can ensure that this data can be trusted. Therefore, all significant data science projects have to start with the data from the authoritative source, even though this means spending weeks on data preparation.
Data science is stuck in a loop where all forward progress is constantly lost because no mechanism exists for making incremental improvements to data.
We believe that the key missing piece of the puzzle is trust. Without trust, collaboration is simply not possible. While an implicit trust within one organization might be enough, trust on a global scale cannot be blind - it is only achievable through transparency, reproducibility, and verifiability of the results.
Open Data Fabric #︎
We created Open Data Fabric (or ODF) to become the world’s first global supply chain for data.
It addresses things like:
- Getting data from publishers to consumers reliably and fast
- Letting people collaborate on cleaning and enriching data in a transparent and verifiable way
- Guaranteeing the reproducibility of all results
- Allowing for reuse of data and making it more readily available
- Creating an environment of verifiable trust between participants without the need for a central authority
ODF is a protocol specification for decentralized exchange and transformation of data. By having an open specification we are hoping to engage with the data community and improve the protocol together.
The protocol is currently implemented in our kamu-cli tool that serves as a reference implementation, and in kamu-engine-spark and kamu-engine-flink that use powerful Apache Spark and Apache Flink frameworks as pluggable data processing engines.
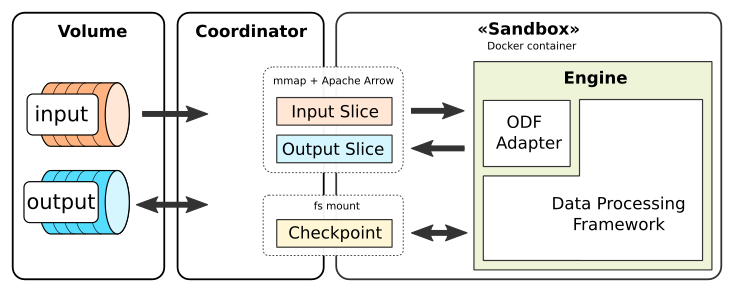
How It Works #︎
If I had to describe the technical side of ODF in one sentence I’d put it as follows:
Open Data Fabric is a decentralized collaborative streaming data processing pipeline with full reproducibility and fine-grain provenance.
I know, it’s a lot to unpack. Below I will give a birds-eye view of the system we’re building. If you’re looking for a technical deep-dive you might want to go straight to the spec.
Decentralization #︎
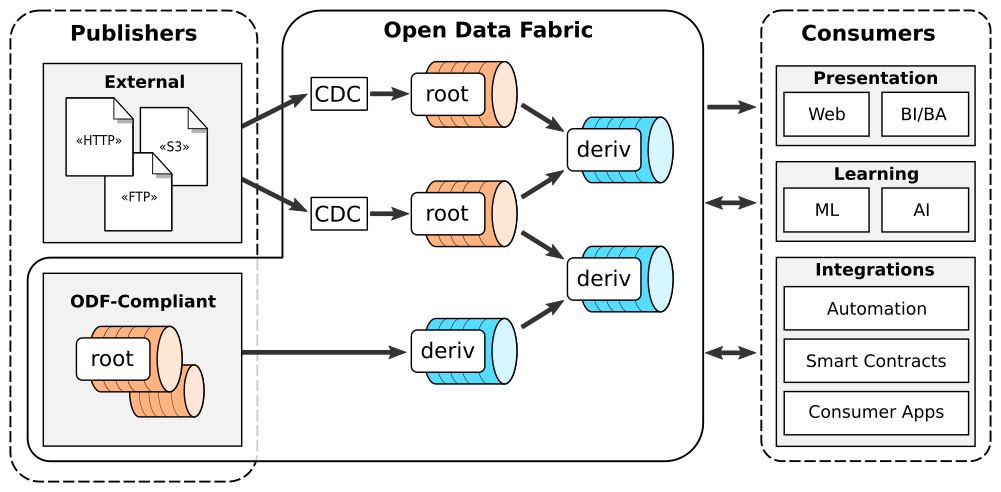
A typical data pipeline consists of an ingest phase where data enters the system and a series of transformation steps that re-shape, filter, aggregate, or enrich data. ODF is like that too, except all of these steps can be owned and maintained by different people.
Data is ingested into the system by creating so-called “root datasets”. You can either push data directly into a Root Dataset or make it monitor a certain URL to periodically pull new data from it.
Data is transformed by creating “derivative datasets”. Such a dataset simply defines its inputs (other datasets) and a query it wants to apply to the data (e.g. SQL aggregation or a join). These transformations can run anywhere: on your laptop, a server, or in the cloud - it doesn’t really matter.
Transformation Graph
As a result, ODF creates a directed acyclic graph of computations where data from any node has a clear maintainer and can be reused by others. It is similar in spirit to having an open-source software project that depends on a bunch of libraries published on GitHub.
Collaboration #︎
“So what?”, you might be asking, “I already can process data in any way I want with SQL or Pandas and share the data and code to Kaggle or GitHub”.
You can, but this only brings us back to the problems of reproducibility and trust - it’s extremely hard for someone to verify your results.
In contrast, all data in ODF stays associated with its source through our metadata system. No matter how long the transformation chain is - you can always trace it back to the ultimate source, understand where it came from and how it was transformed along the way.
ODF guarantees that all transformations are fully reproducible - given the same input data and the same query you are guaranteed to get the same exact result every time.
Putting this together, to fully establish the trustworthiness of the data all you need to do is:
- Audit the queries that produced it
- With a few keystrokes ask the system to verify that data was in fact produced by these queries
This is it - our missing piece of the puzzle! When it’s that easy to validate the data produced by others you can reuse and improve upon their work with confidence - you can collaborate.
There is also strength in numbers - if the datasets you use are popular you will have an army of peers on your side to keep the whole chain constantly in check.
Can you think of another technology that does something similar? Yes, ODF in fact is the most natural way to bridge the domains of Big Data and Blockchain. It fits so well that we think of it as a new pillar of next-generation decentralized Web, providing factual data to Web 3.0 applications and Smart Contracts.
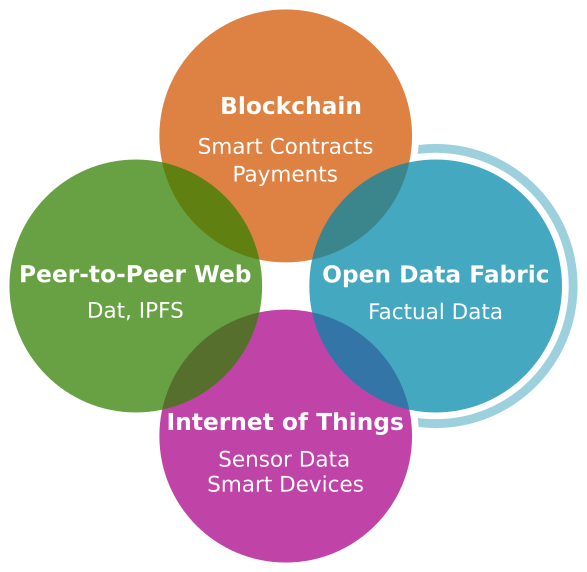
ODF as a pillar of decentralized Web
Immutability #︎
To achieve full reproducibility of transformations we had to do something about the loose definition of what “data” is these days. So many data publishers present their data as database snapshots where data constantly changes or disappears. You cannot achieve reproducibility if your data looks different each day.
In Open Data Fabric data is our modern-day history book - we don’t modify or erase history.
Data is stored in the form of events. Data that isn’t already in this form will be transformed into events through Change Data Capture upon ingestion.
Provenance #︎
The magical combo of immutable data and declarative transformations enables one of the most powerful features of ODF - complete data provenance.
For any event (row) of the dataset ODF lets you easily answer questions like:
- Where did this data come from, and which cells of the original data contributed to it and how they were transformed
- Which cells were inspected to decide that this element should appear in the output
Open Data Fabric lets you trace any cell of any dataset through the entire processing chain down to its ultimate source.
Even the multi-million enterprise data pipelines don’t have such capabilities. Provenance is always an afterthought, but it simply cannot be bolted on top of an existing system, so we designed ODF with complete provenance in mind.
Stream Processing #︎
Remember we said that our goal is to minimize the time it takes data to propagate from publishers to consumers? Turns out the best way to do this is to exclude humans from this process. This means defining transformations in a “write once - run forever” way, which is kinda tricky if you think about how we usually work with data.
Fortunately, the latest advancements in the stream processing technologies suit this use case perfectly. I will need a whole other article to talk about this topic and I highly recommend you to read up on it if you haven’t used it already.
Components of the data transformation
Let’s put a pin in this for now and just say that all transformations in ODF have stream processing nature. This means that instead of usual tables (or data frames) all transformation inputs are potentially infinite steams and so are the outputs.
This processing model turned out to be highly superior to batch processing when working with temporal data and lets you transform and join event streams hassle-free while accounting for all possible event reordering and lagging conditions.
How Does ODF Help Me? #︎
Enough talk about solving the world’s data problems - what can ODF do for you specifically?
If you are still reading this I assume you either work with data daily or you are one of the growing community of DIY data analysts that use data to make more informed life decisions. In both cases, you are painfully familiar with the problems of data preparation and the steep learning curves of the modern tooling.
For the data prep kamu-cli gives you a simple yet powerful framework for ingesting data into a uniform structured format. It’s ideal for fast-moving data sources like financial data as it lets you pull the latest data in with one command where otherwise lots of scripting would be required. I have long converted all my personal data analytics to kamu and let the streaming queries calculate my savings account value, trading performance, and an aggregate dividend income across different accounts and currencies.
We also use multiple public datasets and started cataloging them in kamu-repo-contrib repository. This lets you easily get started with data of such providers like geonames.org, naturalearthdata.com. This repo can give you a sense of what it would be like if those publishers used ODF to provide their data instead of the CSV snapshots with no history.
While we focused mostly on the journey of data through the pipeline, the destination is also important. To satisfy our own DIY analytics needs we have integrated Apache Spark, Apache Livy, and Jupyter Notebooks together in kamu-cli to let you easily query and visualize the data. You can run an SQL query against the dataset and pull the relevant subset of data into the Jupyter notebook, post-process it with Pandas, and visualize it using any of your favorite libraries.
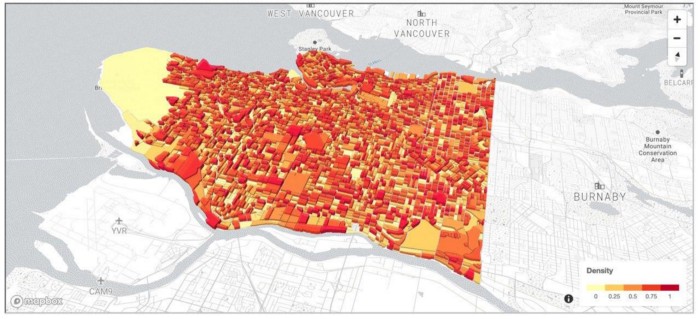
Visualizing Geo-Spatial data in the kamu notebook
Our Spark distribution also comes with Apache Sedona (former GeoSpark) providing you rich geo-spatial functions. More on this in our examples.
What’s Next #︎
There’s so much more left to be said than can fit into one article. If any of this sparked your interest - you should take a look at the spec and give us your feedback.
If you think what we’re doing makes sense - we welcome first adopters of kamu-cli. The tool is still alpha-quality, but now that all critical design decisions are behind us it’s only a matter of time before it reaches a mature state.
If you’d like to support our small team and our project - the best way is to star our repos on GitHub and subscribe to our news.
Thanks for reading, and see you again!